The Problem
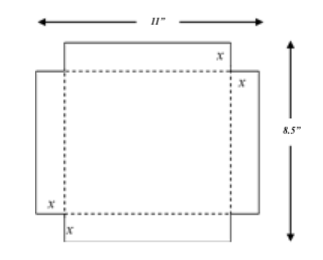
You have an 8.5" x 11" (US Letter Size) sheet of paper.
You want to make an open-top paper box by cutting a square out of each corner and then folding up the sides.
What is the length of the side of each square (corner) cut-out that will produce the maximum possible volume for the box?
You want to make an open-top paper box by cutting a square out of each corner and then folding up the sides.
What is the length of the side of each square (corner) cut-out that will produce the maximum possible volume for the box?
1. Create a function model
|
Let x represent the side of the square cut-outs from the corners.
Write a Volume function: V(x) 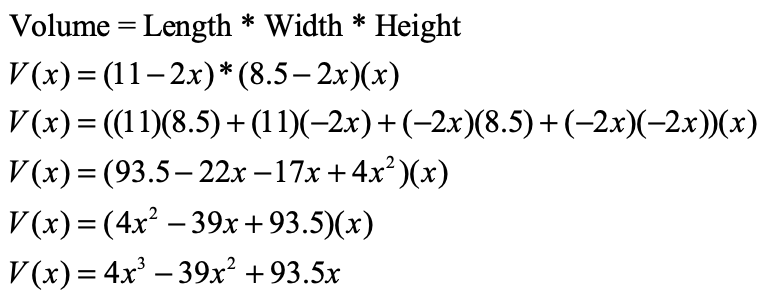
|
2. Figure out the domain of your function: what values might x have?
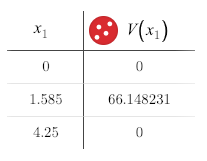
The smallest value that x might have is zero. The associated volume would be 0.
The largest value that x might have is (1/2)(8.5) or 4.25. (This is half the length of the shortest side.
So, the practical domain for our function is [0,4.25]. The associated volume here would also be 0.
The largest value that x might have is (1/2)(8.5) or 4.25. (This is half the length of the shortest side.
So, the practical domain for our function is [0,4.25]. The associated volume here would also be 0.
3. "Optimize" the model, i.e. find the x value that produces the global maximum value for function V(x). Use our procedure for finding extrema!
We know this will occur at a critical point (a place where the derivative is 0 or undefined) or an endpoint.
The derivative is never 0 for this polynomial function.
Where is the derivative equal to 0?
The derivative is never 0 for this polynomial function.
Where is the derivative equal to 0?

|
The table of important values to consider would be as follows:
|
|